Bitcoin Price Prediction: BTC/USD Holds Struggling to Rally Towards the $60,000 Resistance Value

Bitcoin Price Prediction – May 3
The rate at which the BTC/USD market has set on a recovery moving note is being lower-active as compared with some other cryptocurrencies pairing with the US fiat money.
BTC/USD Market
Key Levels:
Resistance levels: $60,000, $65,000, $70,000,
Support levels: $50,000, $45,000, $40,000
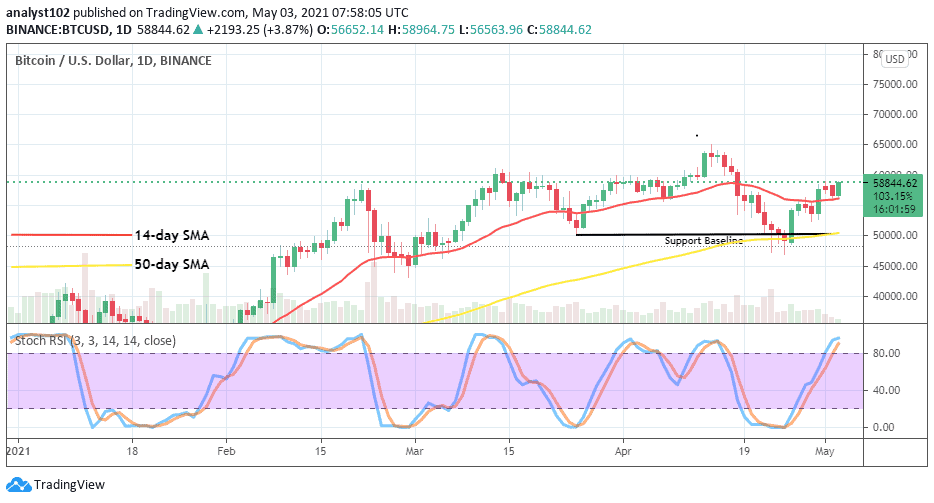
BTC/USD – Daily Chart
The BTC/USD daily trading chart still showcases that the resistance point of $60,000 remains a usual barrier that is yet to be breached northwardly as some higher-low candlesticks have surfaced forming below it since the crypto returns on a recovery moving motion. The 14-day SMA trend-line is located a bit over the support line of $55,000 briefly pointing towards the north as the 50-day SMA indicator is located at the $50,000 level. The Stochastic Oscillators are in the overbought region attempting to close the hairs. And, that may, later on, signal the probability of seeing a consolidation moving situation.
Will the $60,000 level be now tougher for the BTC/USD bulls to break?
Already the much-awaited base-point for recovery move has been established in this market at around $50,000 line. But, the $60,000 has once again come to act as the key resistance line that the BTC/USD bulls need so much to stage a total forceful breakout at this moment. A slight reversal after the presumed breakout isn’t good as it may as well lead to making a difficult trading condition for a smooth appreciating time of the crypto-market.
Analyzing the devaluation trading situation of this market, bears may have to wait for a long time more to see whether the momentum to swing upward past the key $60,000 resistance zone will weak eventually which can give back a strong price correction before considering launching a position. In addition to that, traders need to back up their sell entry with active price action coupled with a good money management principle.
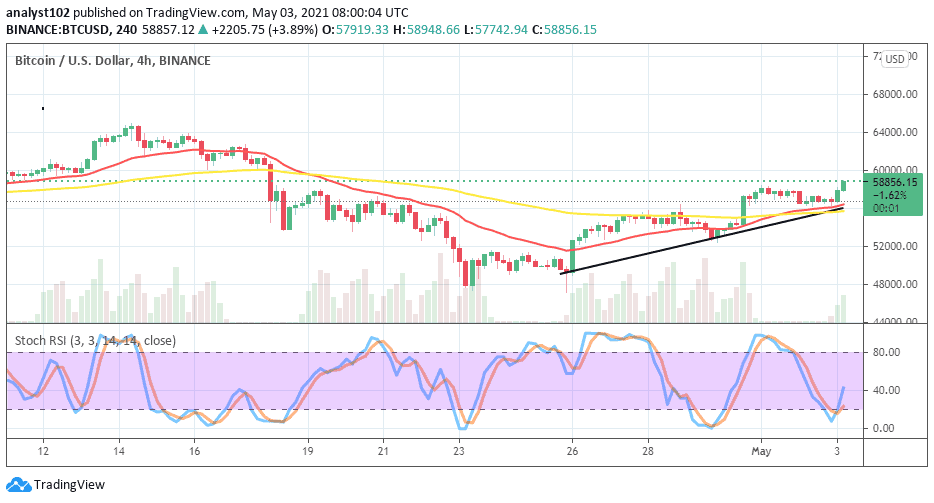
BTC/USD 4-hour Chart
The medium-term 4-hour trading chart yet shows that BTC struggling to push against the valuation of the US Dollar in the market until now. Initially, price has reversed downward to find support around the buy signal side of the smaller indicator before making a short pull-up. In the meantime, the 14-day SMA trend-line is bit located over the 50-day SMA indicator. The Stochastic Oscillators have crossed and swerved from the oversold region towards the north to signal a return of an upswing in the market operations between the flagship crypto and the US fiat currency. That means that there is a higher probability that the crypto’s value is mustering some energies to break through some resistances in the next sessions.


