Bitcoin (BTC/USD) Price Reverses Rallying Motions

Bitcoin Price Prediction – January 31
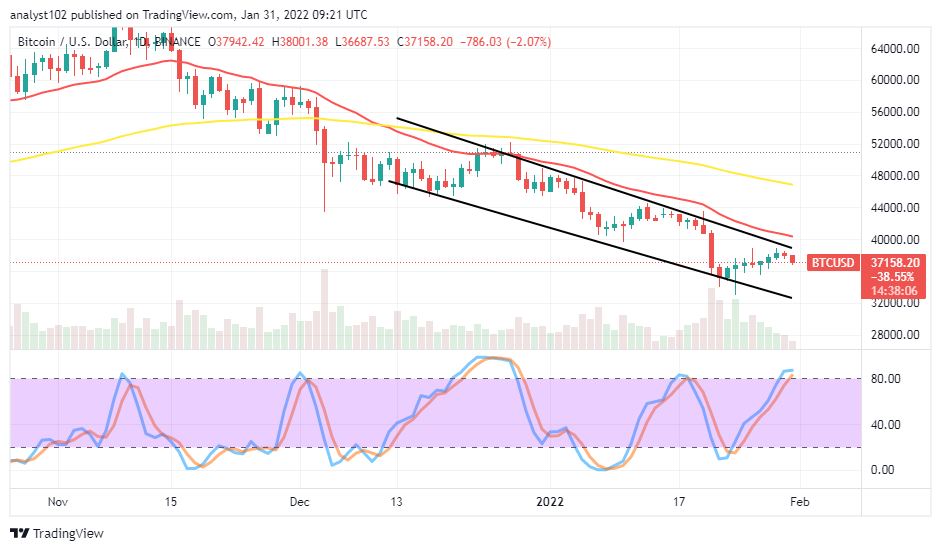
Recently, the BTC/USD market operations traded, struggling to push northward in a bid to recover parts of its lost momentums. But, the crypto-economic price reverses rallying motions for the second time while it couldn’t surge northwardly further toward the $40,000 line. The market now trades around $37,158 between the high and low of $38,001 and $36,687 at a smaller negative percentage of 2.07.
BTC/USD Market
Key Levels:
Resistance levels: $40,000, $42,500, $45,000
Support levels: $35,000, $32,500, $30,000
BTC/USD – Daily Chart
The BTC/USD daily chart reveals the crypto-economic price reverses rallying motions underneath the trend line of the smaller SMA The 14-day SMA indicator bends southward closer to the $40,000 level affirming its resistance validity underneath the 50-day SMA indicator. The upper bearish trend line drew closely beneath the smaller SMA to observe the higher point reached before the reversion moving efforts. The Stochastic Oscillators are partially into the overbought region, attempting to close their lines a bit over the range of 80. That signifies the market tends to lose momentum to the southward side in the near time.
Will the BTC/USD market resume losing momentums soon as the crypto-economic price reverses rallying motions?
Currently, it appears the BTC/USD market is on the verge of resuming losing momentums soon to the downside as the crypto-economic price reverses rallying motions. Therefore, exertion of long positions would now have to suspend for a while. Price may go under headlong until it finds support around $32,500 or $30,000 in the course of heightening the reversal moving force afterward before long-position takers may get repositioned for another round of actions.
On the downside of the technical analysis, the BTC/USD market short-position takers may now be having a decent ordering of sell position as long as the $40,000 resistance remains unbreakable to the upside. The selling pressures have to hold, moving through some support levels between $37,500 and $35,000 on a minimal basis to agree to the fact that the downward trending cycle is still on.
BTC/USD 4-hour Chart
The BTC/USD 4-hour chart exhibits the crypto-economic price reverses rallying motions as it fails to prolong its movement to the $40,000 resistance level. The 50-day SMA indicator has moved southward briefly past the resistance value-line above the 14-day SMA indicator. The smaller SMA trend line has slightly breached southward at the emergence of a bearish candlestick against it. The Stochastic Oscillators have dipped into the oversold region, pointing toward the south to indicate that a declining force is ongoing. Nevertheless, sellers needed to exert more pressure at this trading level of the market to achieve lower points for their advantage at the expense of buyers’ weaknesses.
Looking to buy or trade Bitcoin (BTC) now? Invest at eToro!
68% of retail investor accounts lose money when trading CFDs with this provider.
Read more:


