Bitcoin (BTC/USD) Market Holds Slow-Increasing Pace

Bitcoin Price Prediction – September 16
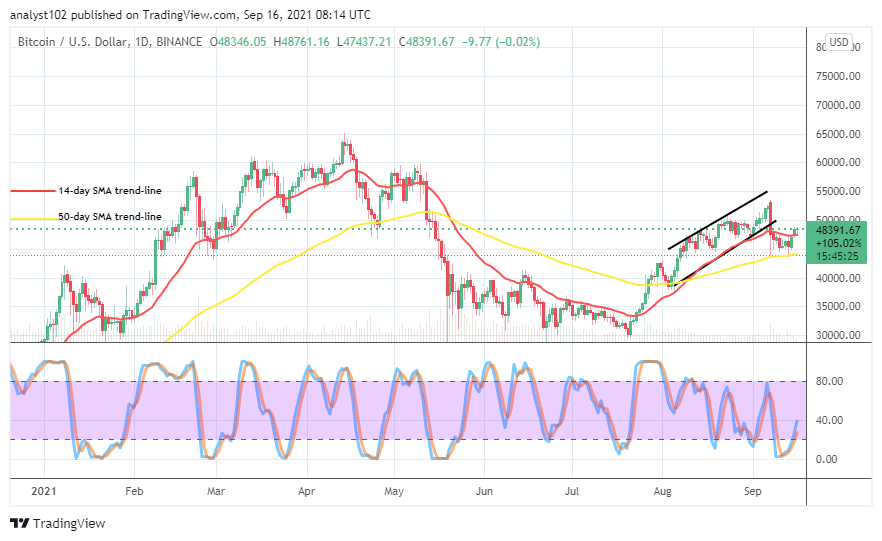
There has been a keen observation that the BTC/USD market holds a slow-increasing pace over a couple of trading days’ sessions. The crypto-economic price keeps a very small rate of about 0.02 percent to trade around the line of $48,391 as of writing. That percentage rating suggests that some slight weaknesses play along as the market struggle to push northward.
BTC/USD Market
Key Levels:
Resistance levels: , $50,000, $52,500, $55,000
Support levels: $45,000, $42,500, $40,000,
BTC/USD – Daily Chart
The BTC/USD daily chart has pictured that the crypto market holds a slow-increasing pace around the trend line of the smaller SMA. The bullish channels are left drawn over the SMAs. The 50-day SMA indicator is underneath the 14-day SMA indicator. The Stochastic Oscillators have crossed northbound from the overbought region, touching close to the range of 40. That indicates that the crypto is still somewhat on course to the upside.
As the BTC/USD market holds a slow-increasing pace, will it sustain to the point of breaching the $50,000 resistance line?
Analyzing the BTC/USD trade from a long-term basis, there is every tendency that the $50,000 resistance will breach in no time as even the market holds a slow-increasing pace presently. Variant slight pull-downs have the probability of re-occurring on lower time frames to find support if that the slow-increasing pace will have to be validly elongated. It would amount to time-consuming or require a lot of effort to observe decent buy entries under such trading arrangements or situations.
On the downside, the BTC/USD market bears may have to wait for the re-action of price around the resistance line at $50,000. Reason for that assumption being that the pushing pattern of the market currently appears to have weight. Any attempt made by the market mover to push southward back at this point may only be for retesting a lower support zone. The market support level at $45,000 now serves as the critical support baseline of the crypto-economic operations.
BTC/USD 4-hour Chart
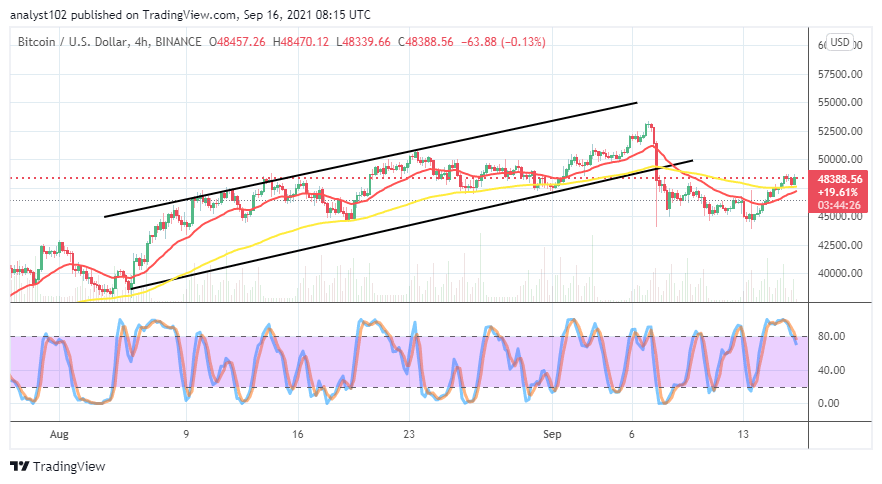
The BTC/USD 4-hour chart shows that the crypto market holds a slow-increasing pace as it now features closely above the trend line of the bigger SMA. The The14-day SMA indicator has briefly curved northward closely beneath the 50-day SMA indicator. The Stochastic Oscillators have slantingly moved southbound against the range 80 from the overbought region. A bullish candlestick now appears in the making to suggest the possibility that price will further go up.
Looking to buy or trade Bitcoin (BTC) now? Invest at eToro!
67% of retail investor accounts lose money when trading CFDs with this provider.
Read more:


