Bitcoin (BTC) Price Prediction: BTC/USD Holds above $42k as Market Forces Reach Equilibrium

Bitcoin Trades Marginally Above $42k as Market Forces Reach Equilibrium
For the past week,
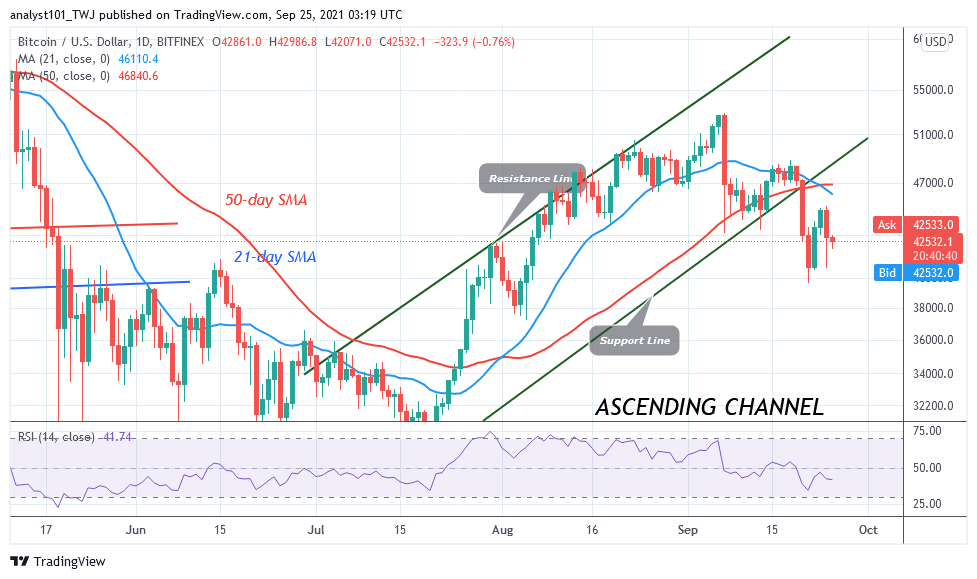
Since September 24, Bitcoin has been trading marginally above the $42,000 price level. For the past three days, the price action has been plagued by small body indecisive candlesticks called Doji and Spinning tops. When these candlesticks appear, it is describing that buyers and sellers are in a short recess. In other words, sellers and buyers are undecided about the direction of the market. Under the current dispensation, there is the likelihood of a price breakout or breakdown. For instance, Bitcoin will drop sharply to the $37,000 low, if the bears break below the $40,000 support. Similarly, Bitcoin will resume upside momentum if the bulls clear the resistance at levels $45,000 and $48,800 highs. Today, the small body candlesticks are appearing as Bitcoin consolidates above $42,000 support.
Big Investors Switch from Bitcoin to Ether Futures, by JP Morgan
American multinational investment bank, JPMorgan has disclosed that institutional investors are switching from Bitcoin-based products in favor of Ether derivatives. Presently, Ether futures are trading at a premium as investors make the switch from Bitcoin-based products. Because of this, Ethereum-based products are more attractive to investors as they switch to the world’s biggest altcoin. Analysts believe that there has been a “strong divergence in demand,” before adding: “This is a setback for Bitcoin and a reflection of weak demand by institutional investors that tend to use regulated CME futures contracts to gain exposure to Bitcoin,”

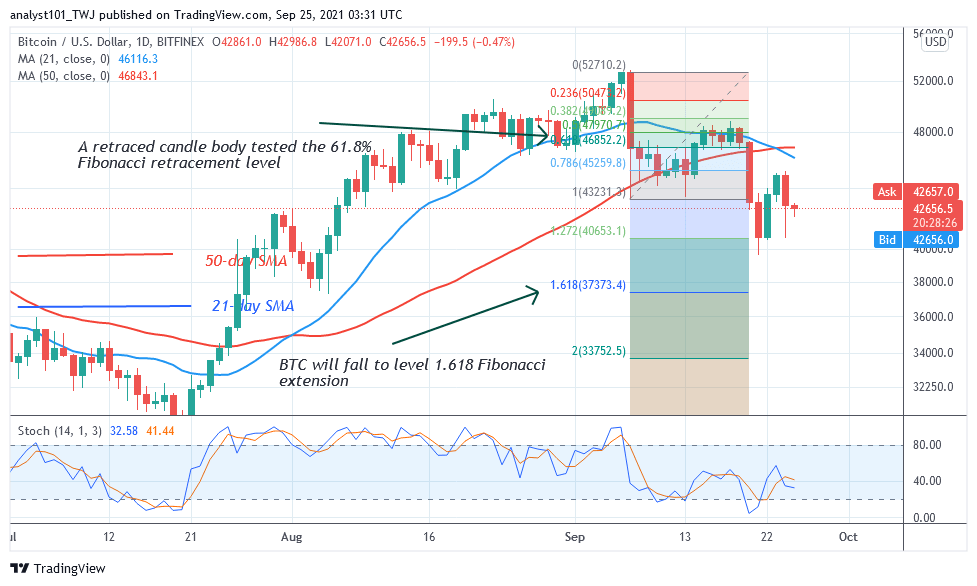
Nevertheless, Bitcoin is relatively stable above the $42,000 price level as market forces reach equilibrium. A breakout will invalidate the Fibonacci tool analysis as Bitcoin resumes upward. A breakdown will validate the Fibonacci tool analysis below. That is, on September 7 downtrend; a retraced candle body tested the 61.8% Fibonacci retracement level. The retracement indicates that the BTC price will fall to level 1.618 Fibonacci extension or level $37,373.40.
Looking to buy or trade Bitcoin (BTC) now? Invest at eToro!
67% of retail investor accounts lose money when trading CFDs with this provider
Read more:
• How to buy Bitcoin
• How to buy cryptocurrency


