Bitcoin (BTC/USD) Market Transaction Keeps Increment

Bitcoin Price Prediction – August 23
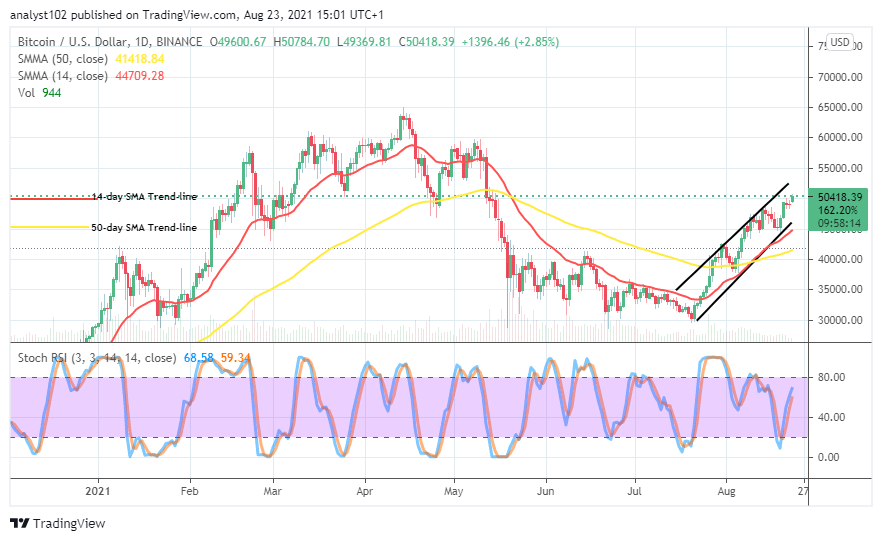
The BTC/USD market transaction keeps an increment in line with the bullish channel trend lines drawn for sessions until the present. The crypto’s percentage rate amounted to a positive number of 2.85 to trade around $50,418 as of writing.
BTC/USD Market
Key Levels:
Resistance levels: $52,500, $50,000, $57,500
Support levels: $45,000, $42,500, $40,000
BTC/USD – Daily Chart
The daily chart reveals that the BTC/USD market transaction keeps increment within the channels of bullish trend lines drawn. There is an extension in the bullish channel trend lines drawn to monitor the increment in the valuation of the crypto within it. The drawing of the lower bullish channel trend-line features a bit over the smaller SMA indicator. The 50-day SMA trend-line is underneath the 14-day SMA trend-line. The Stochastic Oscillators look like attempting to curve the lines southbound near beneath the range of 80. That suggests that some amounts of downward forces may play out soon in the crypto market.
What could be the subsequent price action as the BT/USD market transaction keeps increment?
Price may hit resistance at a higher trading zone very soon as the BTC/USD market transaction keeps increment. The market tends to relax upside pressures while a notable fresh higher point is witnessed as it even embarks upon an increasing moving mood as shown in the purview of bullish channel trend lines drawn. Therefore, it would now sound technically ideal that some of buying intense be suspended for a while.
About the downside of this crypto economy, it is most likely that the market will succumb to a resistant force around the $50,000 line as it has freshly re-visited during the present upward pressures. In that case, the BTC/USD market bears needed to be on the lookout for an active reversal movement of the crypto’s price to fish out a sell entry. Either 1-hour or 4-hour could use to determine the exit position, especially while a bullish candlestick tends to emerge against the 14-day SMA trend-line at a lower trading side.
BTC/USD 4-hour Chart
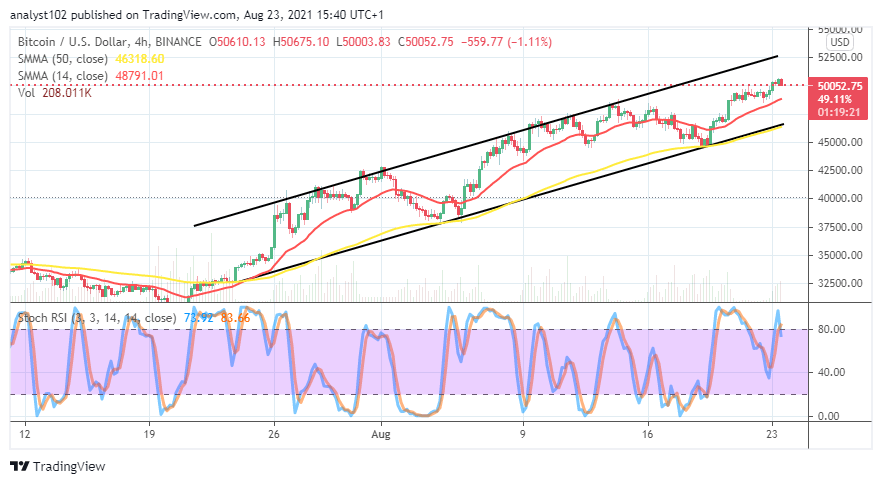
Even though the BTC/USD market transaction keeps increment in the bullish channel trend-lines drawn until now, the daily chart shows some probable signs that price may soon witness a downturn in its valuation. The 14-day SMA indicator trends closely beneath the current trading line over the 50-day SMA indicator. The Stochastic Oscillators have penetrated the overbought region with an attempt to cross back the lines southbound against the range at 80. It appears that a downward force is imminent in the crypto market. Therefore, traders may brace up for exertion of shorting around where it faces strong reversal motion.
Looking to buy or trade Bitcoin (BTC) now? Invest at eToro!
75% of retail investor accounts lose money when trading CFDs with this provide.


