Ethereum Price Prediction: ETH/USD Prepares for $3500 Resistance

Ethereum Price Prediction – August 15
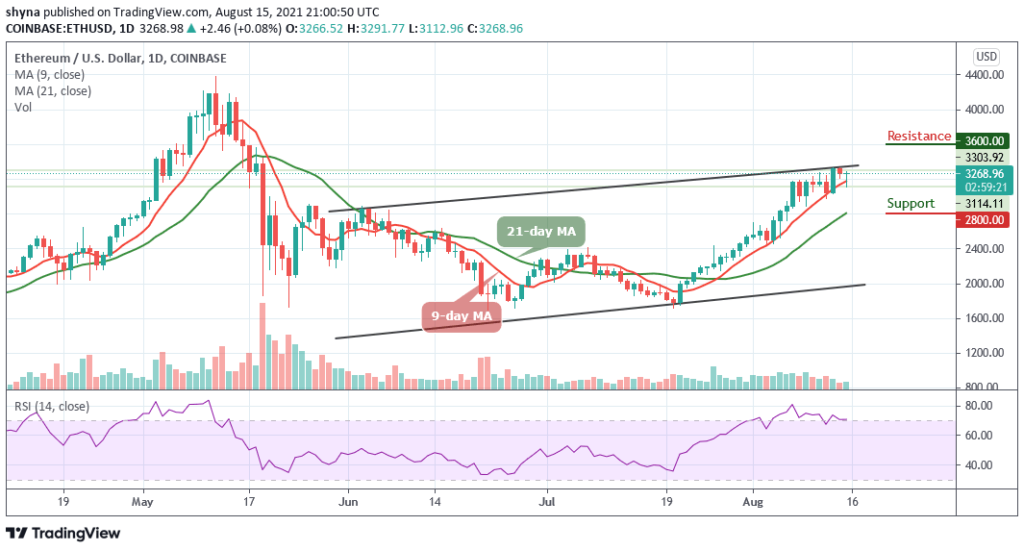
The Ethereum price prediction is getting ready to cross above the upper boundary of the channel after a rapid retracement.
ETH/USD Market
Key Levels:
Resistance levels: $3600, $3700, $3800
Support levels: $2800, $2700, $2600
ETH/USD is currently recovering above the opening price of $3266 and it is likely to climb above $3500 soon. Meanwhile, the Ethereum price has been trading above the 9-day and 21-day moving averages for the past few days as bulls continue to dominate the market. However, the monthly high remains at $3333 with the nearest support level located below the 9-day moving average at $3000.
Ethereum Price Prediction: Ethereum Price Could Reach $3500
The Ethereum price stays above the 9-day and 21-day moving averages. If ETH/USD breaks above the upper boundary of the channel, it could revisit an important resistance at $3400. However, a successful break above the channel could open another increase above the $3500 level. However, the price is likely to rise towards the $3600, $3700, and $3800 resistance levels in the next positive directions.
Moreover, as the technical indicator Relative Strength Index (14) moves within the overbought region, meaning that the market remains at the upside but breaking below this level, may cause the coin to cross below the 9-day moving average and should this come to focus, ETH/USD could touch the $3000 support. The next major support is near the 21-day MA, where the bulls are likely to take a strong stand but any further losses could lead the price towards the $2800, $2700, and $2600 support levels.
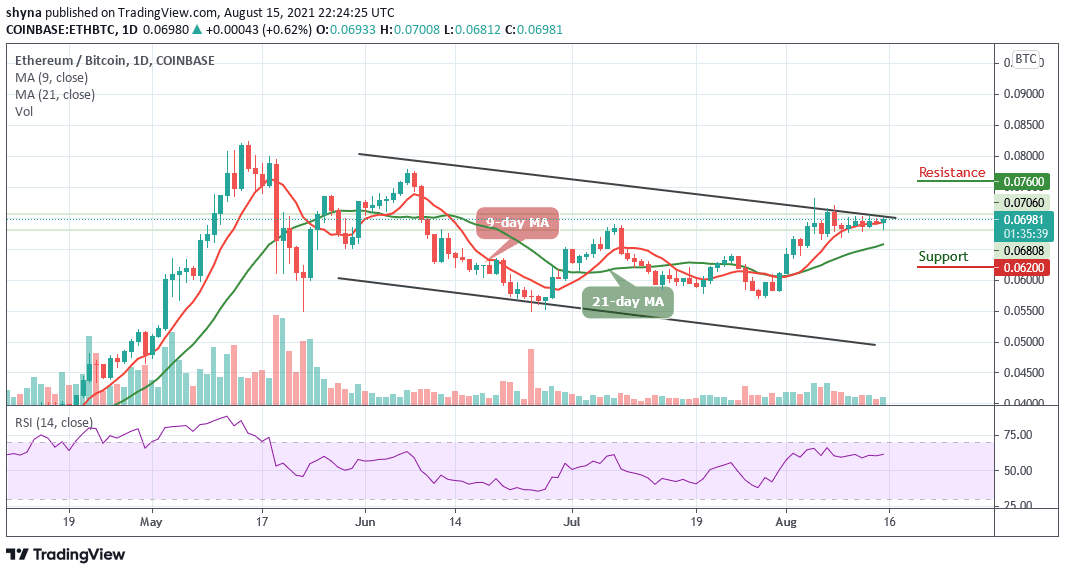
When compares with Bitcoin, the Ethereum price is now moving above the 9-day and 21-day moving averages as the market keeps changing trends; approaching the upper boundary of the channel. Meanwhile, the technical indicator Relative Strength Index (14) is revealed moving in the same direction, a sideways movement confirmation.

However, if the price breaks above the upper boundary of the channel, bulls might push the market back to the resistance level of 7500 SAT. Moreover, if the price stays above this level, traders may expect an immediate resistance at 7600 SAT and above. On the other hand, crossing below the 9-day and 21-day moving averages may locate the supports level at 6200 SAT and below.
Looking to buy or trade Ethereum (ETH) now? Invest at eToro!
75% of retail investor accounts lose money when trading CFDs with this provider


