Figuring Out How Much Bitcoin Hashrate Resides in Mainland China Still a Mystery
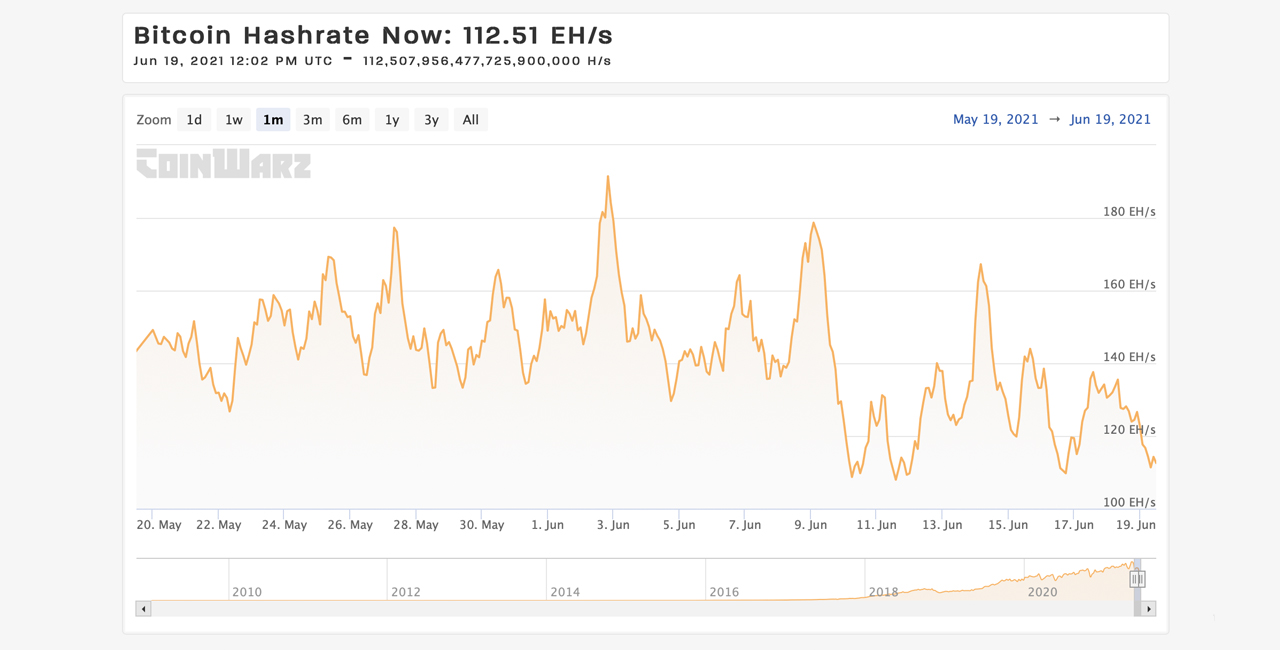
Over the last few weeks, there have been many reports about crackdowns in China tied to bitcoin mining operations in various provinces. 30-day statistics show the hashrate has been fluctuating wildly, and across the last week it has slid downward roughly 26%.
Reports Show Bitcoin Mining Crackdowns in Five Chinese Provinces
Despite the slide, the top three mining pools in the world, which represent roughly 41% of the hashrate today, are considered Chinese mining pools. This doesn’t necessarily mean the mining pools actually host physical bitcoin mining facilities in mainland China, however.
How much hashrate resides in China is the million-dollar question these days. Especially after Beijing’s crackdown on the mining industry and the following bans in a number of provinces.

The mandates first appeared in Inner Mongolia, as reports surfaced during the first week of March 2021. Then on June 9, 2021, a report disclosed that specific bitcoin miners in Xinjiang had been instructed to shut down.
Another mandate appeared for crypto miners in Qinghai province. After Qinghai province, authorities in Yunnan cracked down on bitcoin mining operations in that region as well.
Then, while everyone was waiting to hear about Sichuan, following the May 31 report that notified the public a meeting was taking place, the news finally came. Officials in Sichuan sent notice to bitcoin miners in the province to shut down by June 25.
Existing Hashrate Reference Maps and Faults Found in Assumptions
Hashrate charts show during the last seven days, the Bitcoin network hashrate has slipped and currently hovers a hair above the 100 exahash per second (EH/s) zone. The issue is no one is quite sure exactly how much hashrate resides in China, and how many operations are forced to migrate.
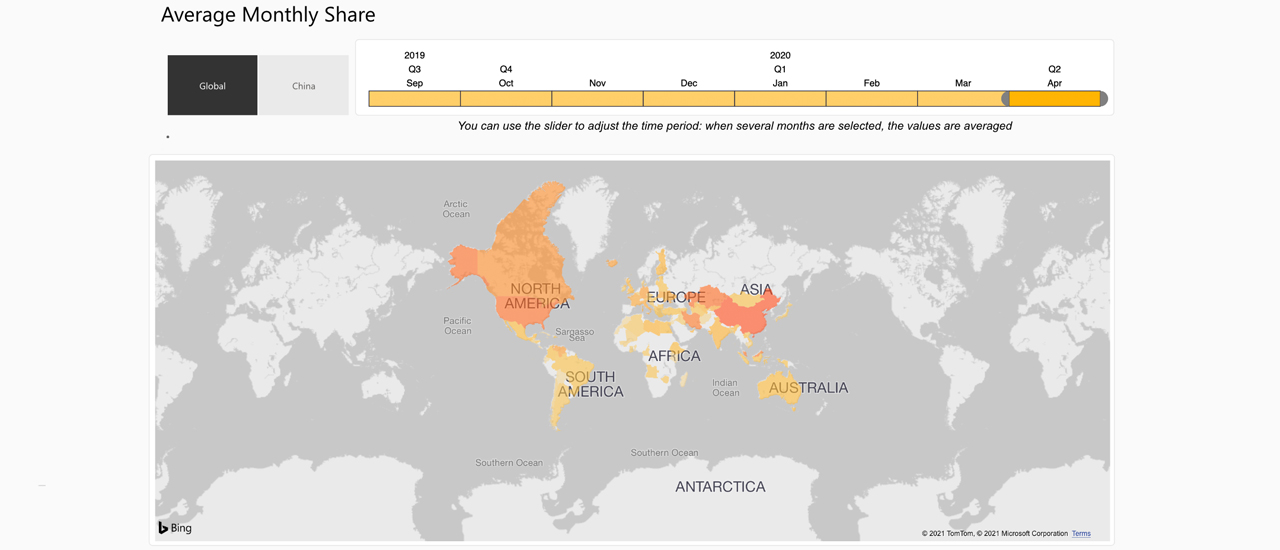
Many mainstream reports pointed to the Cambridge Center for Alternative Finance index map, otherwise known as CBECI. The unreliable CBECI map hasn’t been updated since April 2020 and the map indicates 65% of the hashrate is in China.
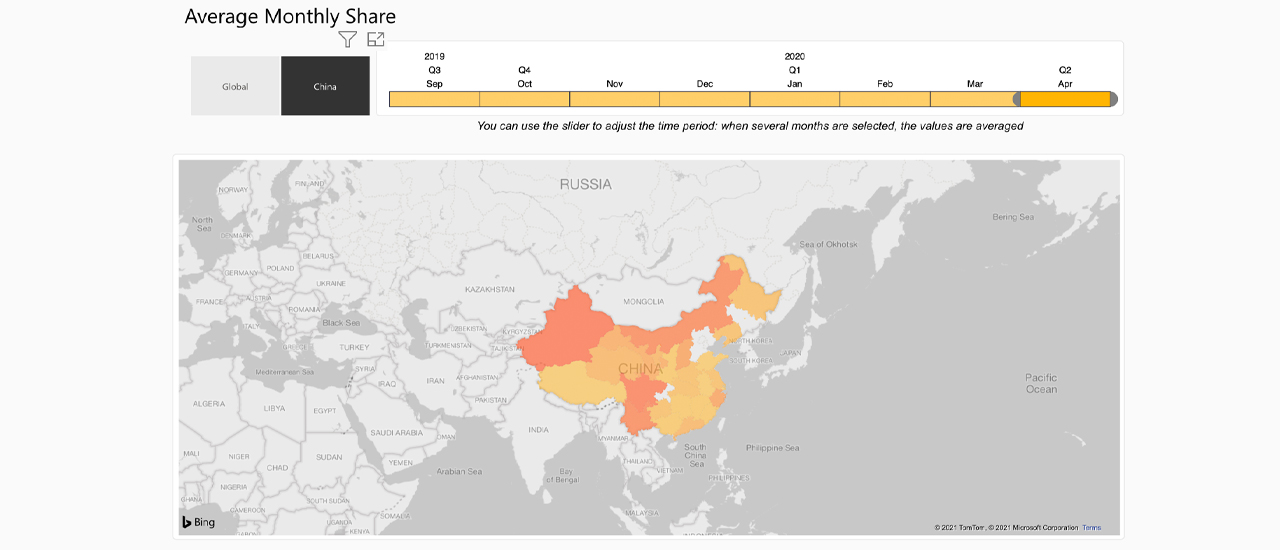
The CBECI data also has significant limitations toward estimation, as it only collects data from three large pools and the “aggregate geo-location data based on the IP addresses of hashers connecting to mining pools.” Cambridge further notes that “hashers in certain locations use virtual private networks (VPNs) or proxy services to hide their IP address and thus location.”
Moreover, at any given time, a large number of stealth miners have been known to dedicate hashrate to the BTC network. These stealth miners, otherwise dubbed as “unknown” in hash distribution pie charts, make up around 6% of the network hashrate this weekend. At times, during the last few years, mystery miners have gathered more than 20% of the hashrate.
The web portal digiconomist.net is similar, as it shows an unreliable chart with shares of the Bitcoin network’s hashrate, but it too has not been updated since April 2020. In China, digiconomist.net’s survey shows operations in Beijing, Nei Mongol, Guangdong, Qinghai, Yunnan, Sichuan, Shanxi, Guizhou, Gansu, Ningxia, Shaanxi, Zhejiang, and Hebei.
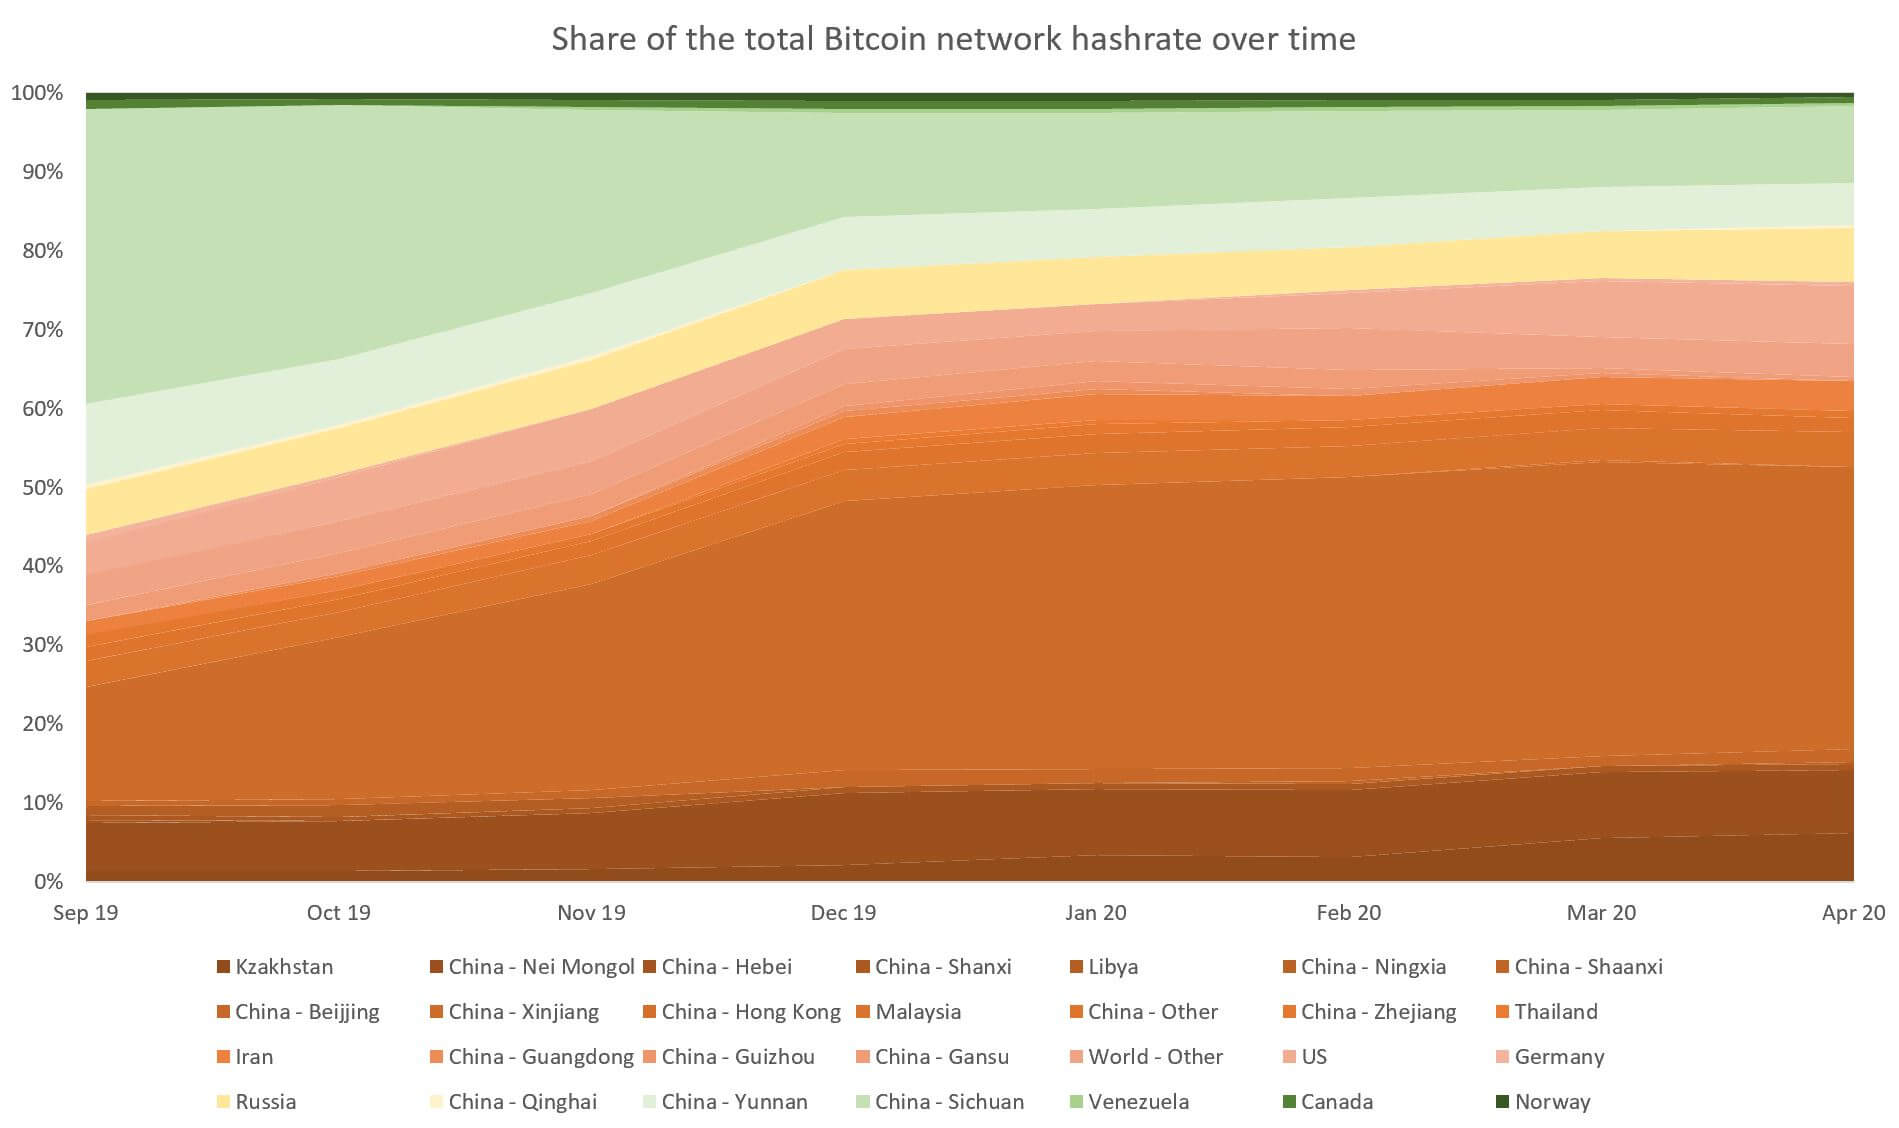
There’s also a published study from Coinshares, which highlighted that 74% of the world’s bitcoin mining operations were driven by renewable energy in 2019. The in-depth report does contain a survey of a number of mining locations around the world and includes a map.
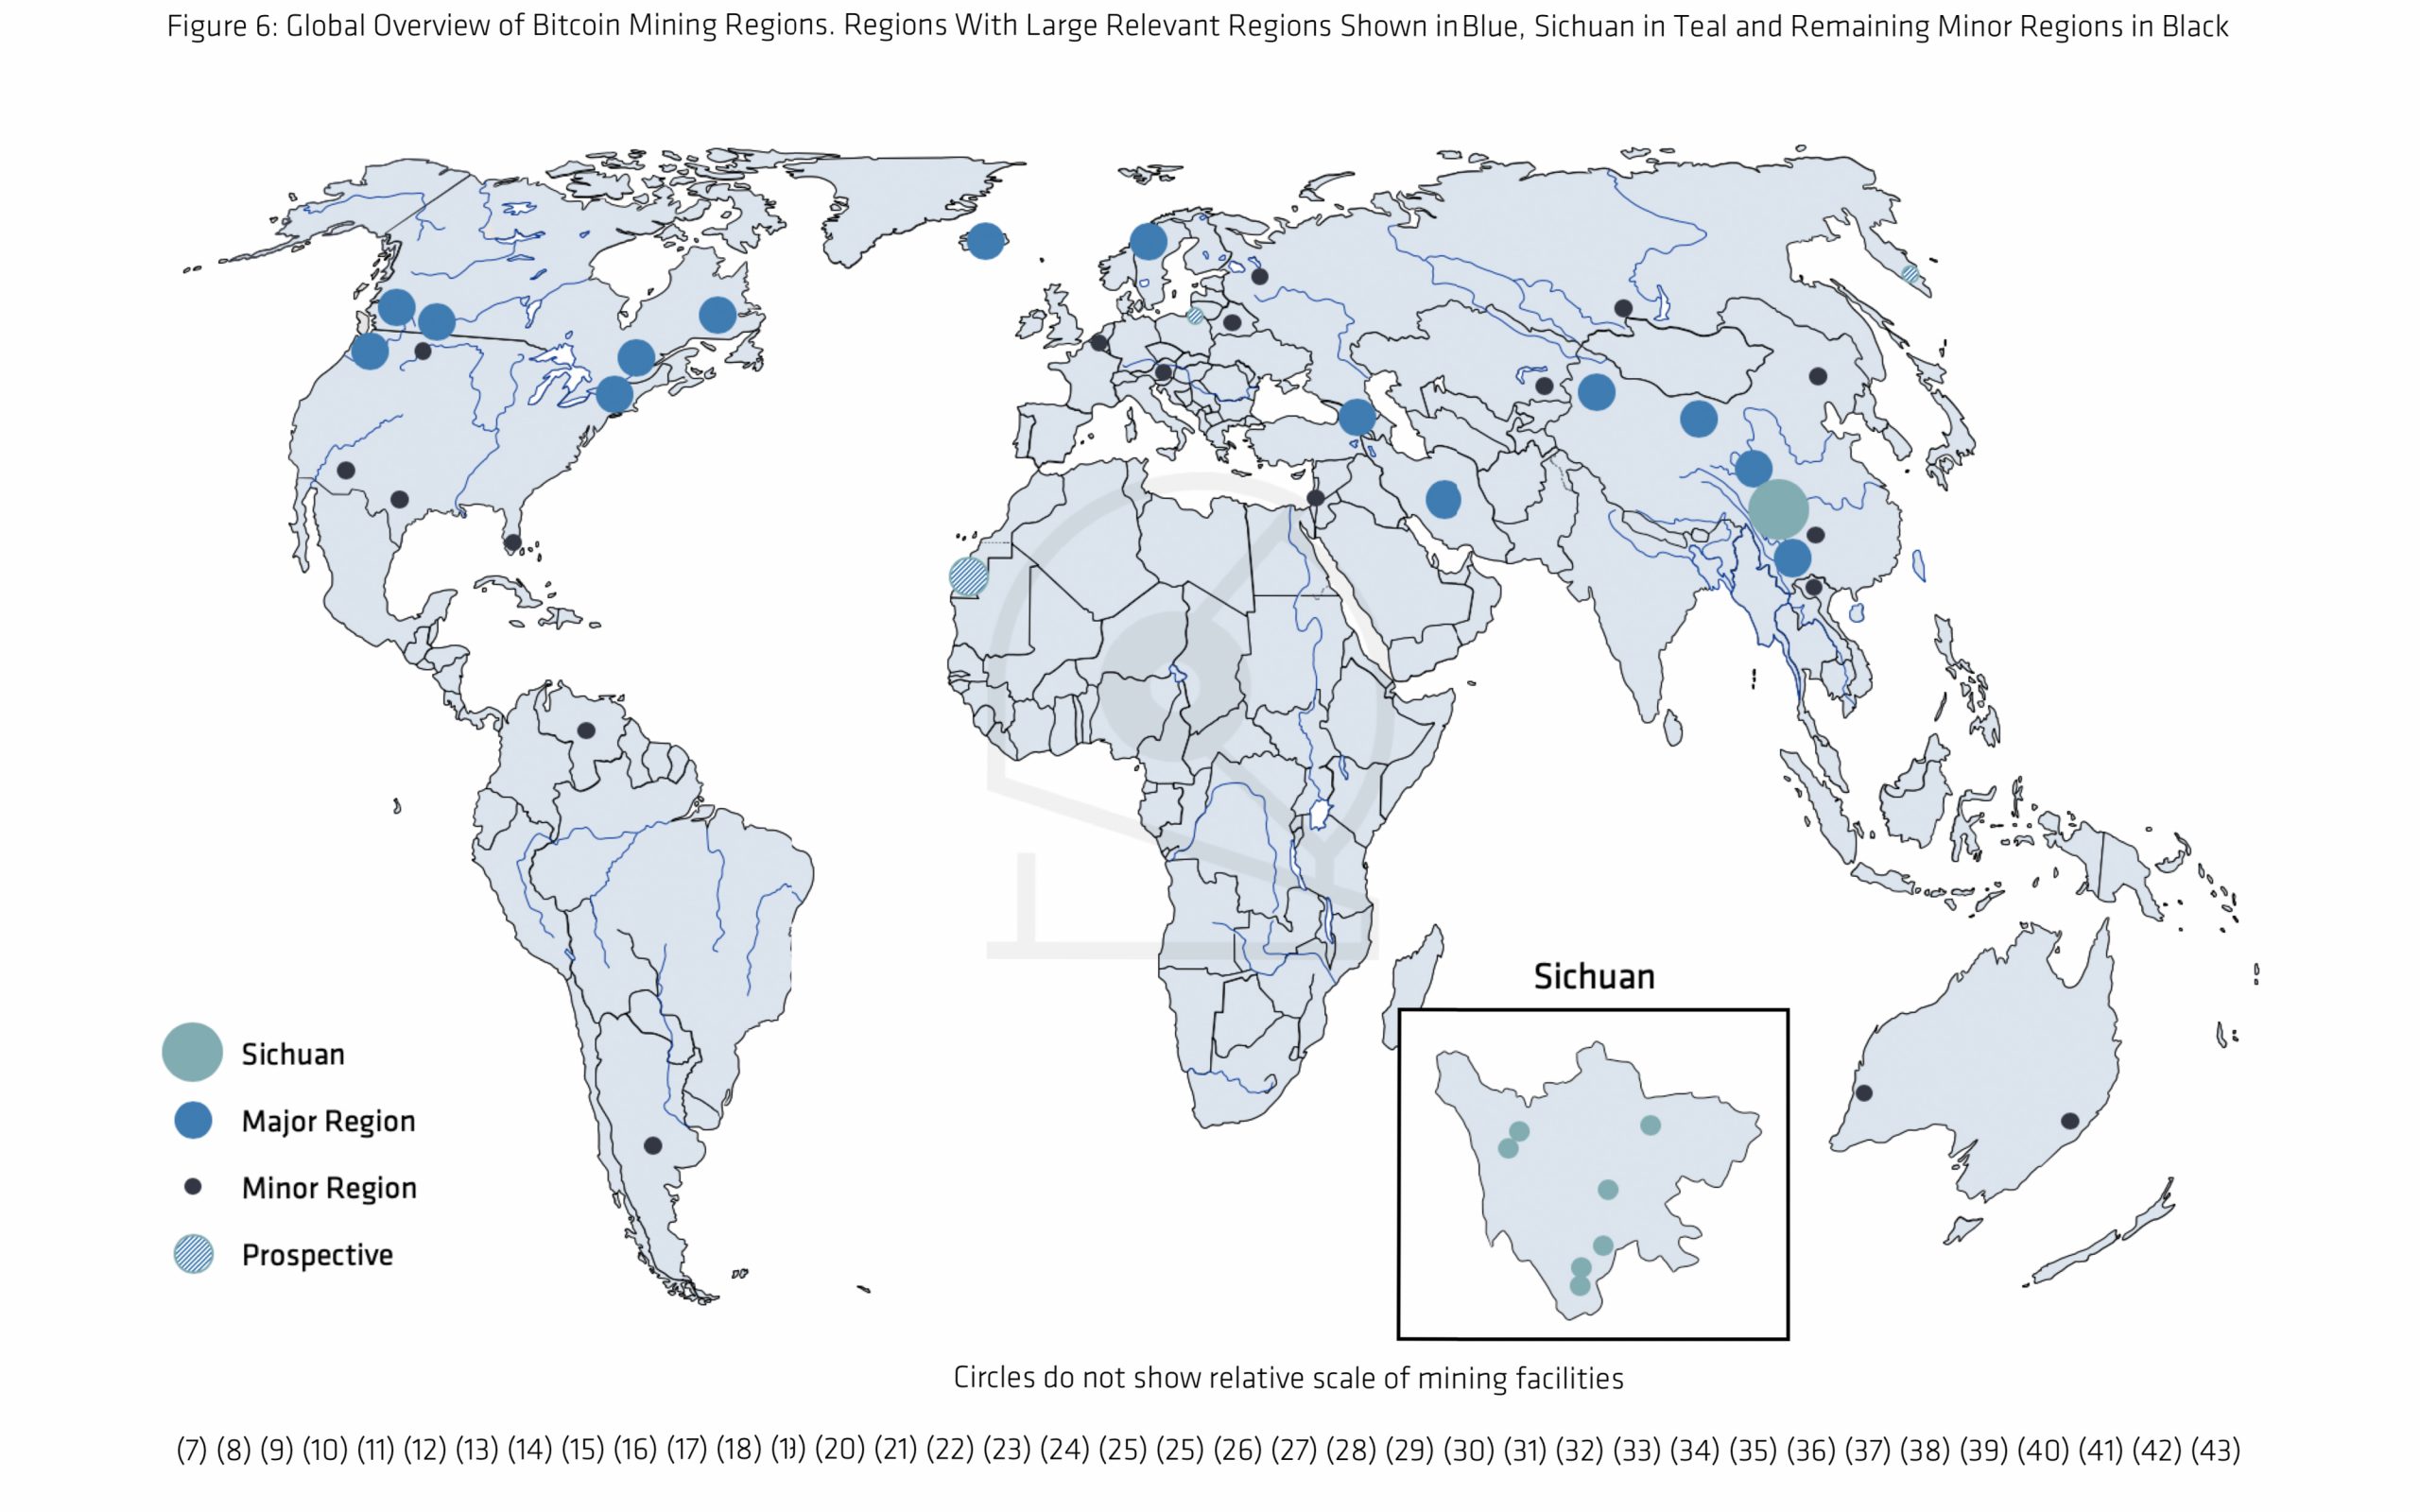
The Coinshares’ map is fairly basic but conveys the general idea that there’s a large portion of miners in China and specifically Sichuan. Between the CBECI map, digiconomist.net chart, and Coinshares’ report we still don’t have an up-to-date percentage of how many miners are located in China.
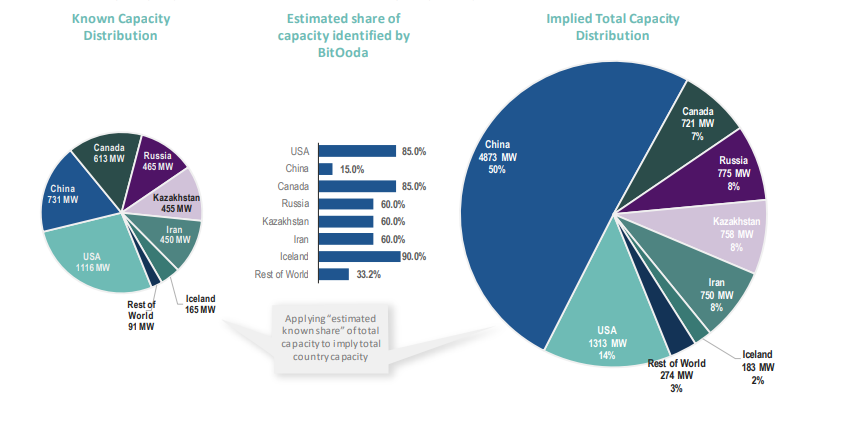
However, there’s a recent report from July 15, 2020, published by Bitooda with support from asset manager Fidelity Investments that cuts China’s hashrate down to 50% from previous estimates.
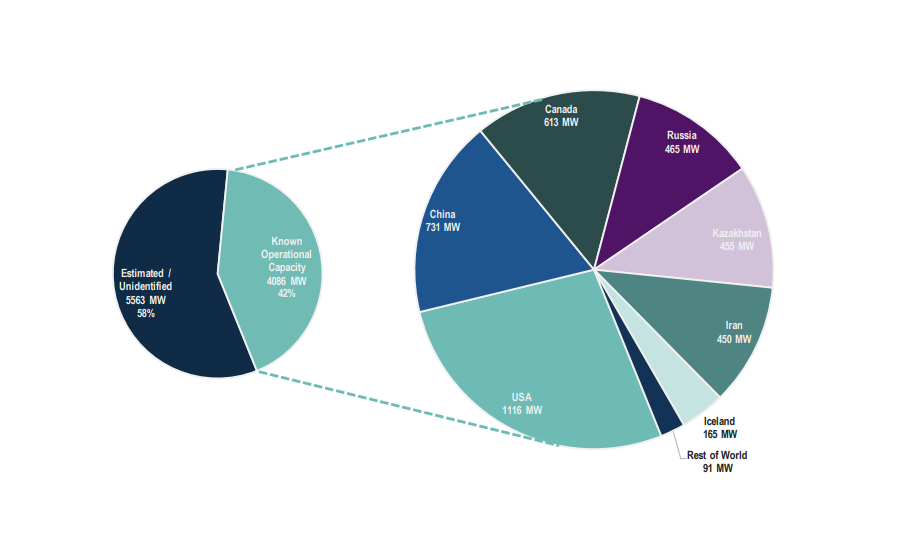
Additionally, faults in the assumptions underpinning the digiconomist.net data have been found. In 2018, another Coinshares’ study had shown criticism toward the Digiconomist’s BECI and noted there was a large discrepancy regarding the total energy consumption data.
Hashrate Distribution and Ostensible Headquarters
Finally, the public does have access to data from hashrate distribution by pool names. The top five dominant mining pools today are Antpool, Viabtc, F2pool, Btc.com, and Poolin. In terms of hashrate percentage, below Poolin is Binance Pool, an unknown entity, and Foundry USA, respectively.
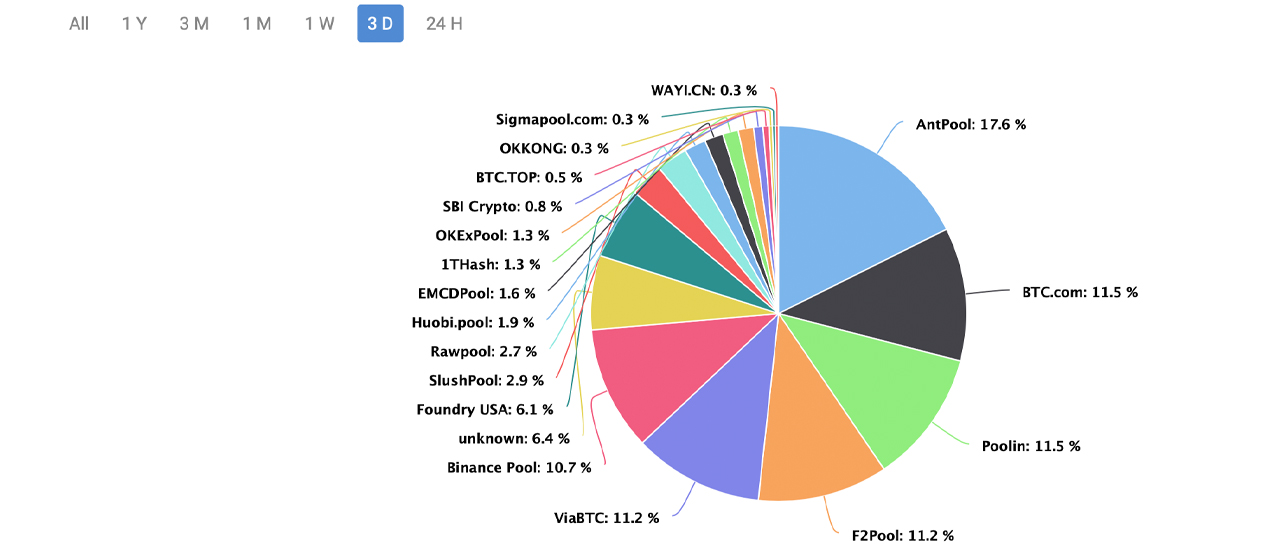
Measuring data this way is faulty because not all pools are hard operations, as many pools are a mix of hashpower from physical facilities and miners from all around the world pooling computing power with the pool. There is no known location for Binance Pool and Poolin says its operation is headquartered in Hong Kong.
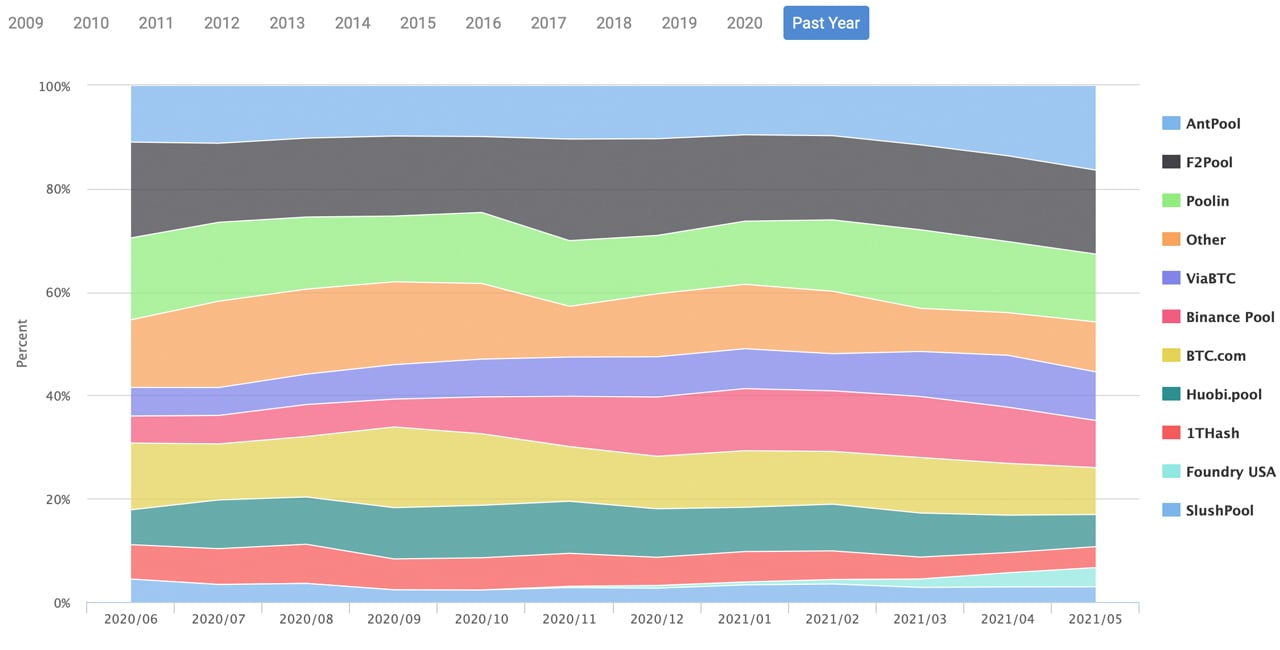
Poolin’s website details that it does have offices in Beijing, Chengdu, and Changsha, China. Bitmain’s Antpool says its headquarters is in China, and Viabtc’s records and F2pool (formally known as Discus Fish) also show China-based headquarters.
Btc.com’s records indicate the mining company’s headquarters resides in Amsterdam. Roughly 41% of the hashrate could be considered as being from Chinese pools, but we cannot be sure of how much of this hashpower actually stems from mainland China.
As stated previously, Chinese bitcoin mining pools are not necessarily located in China. Fact is, figuring out exactly how much bitcoin hashrate resides in mainland China is still a puzzle. Look out for the follow-up to this comprehensive report that covers the complete landscape of Bitcoin hashrate distribution over the last 12 years.
What do you think about the geographical locations of miners? How much hashrate do you think resides in China? Let us know what you think about this subject in the comments section below.


